I read this paper about most research findings being false. Given that most research papers in SAT take a sample size that is incredibly small (especially considering that it’s cheap to have large sample sizes relative to, e.g. medical trials), and the samples are very often hand-picked, it’s easy to see why this could be the case. But that article lists a number of other factors, too, and they are interesting to consider as well. Only few true innovations stick around in SAT (glues, VSIDS, UIP, restarts, etc). Most are forgotten because, frankly, they didn’t show the promise they purported to have. It’d be interesting to force authors to e.g. run their systems on much larger sample sizes (e.g. 2-3000 instances from SAT competitions) with much longer timeouts (e.g. 5000s). Then those implementing SAT solvers wouldn’t have to wade through piles of articles to get to something worth implementing. One is allowed to dream.
Category Archives: Uncategorized
CryptoMiniSat 5.0.1 released — with MIT license
A new version of CryptoMiniSat, 5.0.1 has been released. It is essentially only a release to mark the move to a much more permissive, MIT license. I am changing the license so that everyone can use the system as they wish, however they wish. I want to give back to the community I have been part of for so long, and so I am making this change. Thank you all for using the solver, it makes me happy that I have been able to help some with my hobby work.
Benchmark randomisation for SAT Comp’16
Things are heating up for the SAT competition 2016. I will of course compete. However, I would publicly like to ask the organisers to please for the love of whatever you believe in, please randomise the benchmarks. Just a tiny, little bit. It’s ridiculous that people are tuning their solvers so they can solve some randomly solveable instance like the vmpc* series. It’s laughable and it’s making the whole community look bad. Really, it’s time to stop this madness. I wrote that article with a bunch of ideas in 2013. It’s time. Not even the largest of organisations move this slowly, and this is a research group of about 50 people max.
STP and CryptoMiniSat in the competitions of 2015
Both the SAT Race and the SMT competition of 2015 are now over. The results are in and it’s time to draw some conclusions. CryptoMiniSat won the SAT Race’s incremental solving track, and the SMT solver that uses (among other solvers) CryptoMiniSat, CVC4, won the SMT competiton. These two wins are not unrelated — CryptoMiniSat is used in an incremental way by the CVC4 team. What CryptoMiniSat and STP (the other project I work on) hasn’t done is win their respective main competitions. Let me reflect on these quickly.
The SMT competition
The SMT competition’s quantifier free boolean vector track (QF_BV) was won by Boolector. Boolector is an amazing piece of engineering and so is the SAT solver it uses, lingeling. Second was CVC using CryptoMiniSat and third was STP. The reason for STP being third was because I managed to add a bug into STP and never fuzzed it. So now fuzzing is part of the continuous integration suite. Without this bug, STP would have come pretty close to Boolector, of which I’m proud of.
In general, STP needs to be greatly overhauled. It’s a legacy codebase with global variables, weird dependencies and long list of weirdnesses. It’s also performing amazingly well, so one needs to be careful how to approach it. I have been trying to cut it up and slice it any way I can so it makes more sense to read the code and work on it, but it’s still quite hard.
The SAT competition
The SAT competition had its share of surprises. One such surprise was that lingeling didn’t win any main prizes. I wonder why it wasn’t submitted to the incremental track, for example. Another surprise was the 1st and 2nd places of two solvers by the same author, Jingchao Chen, who unfortunately I have never met or conversed with. I was also a bit disappointed that CryptoMiniSat didn’t make it too high on the list. There have been a number of issues I tried to fix, but apparently that wasn’t enough. I will be interested in the sources of the winning solvers, see if I can learn something from them.
It’s really hard to create winning SAT solvers that behave well in all circumstances because it takes massive amount of time to code them up and properly test them. Especially the latter is really complicated and writing good test harnesses takes concentrated effort. My test scripts are easily over a thousand lines of code, mostly python. The continuous integration and build systems (both necessary for timely releases) are another thousand, and my AWS scripts for performance testing is almost a thousand as well. That’s more code than some early, well-performing SAT solvers had.
Continue reading
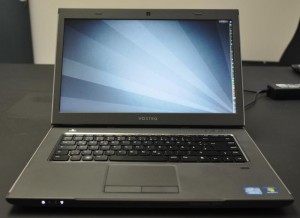
My Dell Vostro 3560 review
In this post I would like to share with you a personal review of my new business line laptop from Dell, the Vostro 3560. It’s a 15.6″ laptop that has Full HD screen using TN display technology, a 750GB HDD spinning at 7500rpm, 6GB of DDR3 RAM clocked at 1600MHz, with the highest possible Core i7 processor available for this machine, the i7-3612QM, that goes to 3.1GHz with all cores still active.

Overview of the laptop
The good
First, let me talk about what I found to be great about this laptop. The display is great: it’s sharp, the colors are good and it’s bright enough even in strong sunlight — though admittedly here in Berlin there is not much of that.
The keyboard is also magnificent. It’s one of the best keyboards I have ever used, even though I am very particular about my peripherals, especially keyboards and mice. I used to own business Thinkpads and this is the first keyboard that I have found to be as good as or maybe even better than a Thinkpad keyboard.
The system is built sturdily, and the materials used don’t feel cheap in your hands. Though the system isn’t light, it feels easy to hold due to its rigidity and smooth (but not slippery) surfaces.
Finally, the system contains extras that are only mentioned in the service manual. For example, there is an mSATA socket inside the laptop, meaning you can plug a 256GB mSATA SSD into the system in a couple of minutes for a reasonable price (around 200EUR), significantly speeding things up.
The mediocre
The CPU is a trade-off. It’s not the i7-3610QM which would go up to 3.3GHz with all cores still active. The reason for this is interestingly not price: the two CPUs cost the same from intel — the reason is heat removal. The CPU installed only generates 35W of heat while the other generates 45W. Essentially, Dell didn’t work hard enough on the cooling system and the result is that a better CPU cannot be installed. Unfortunately, Dell is not the only one that couldn’t install the 3610QM, other manufacturers such as Sony with the Vaio S series had the same issue. Naturally, Apple with the new MacBook Pro lineup didn’t mess this up.
The included charger is rather bulky. Interestingly, there is a slimmer charger available, for a mere 114 EUR — the one included costs 50EUR on the same Dell webpage. I find this to be rather disappointing.

Bulky charger included

Slim charger, available at 114EUR
The wireless card inside the system doesn’t support 5GHz WiFi. This sounds minor, until you go to a conference or a public place with a WiFi where everyone seems to be able to connect, except you. 2.4GHz WiFi uses a band that is substantially more noisy and since routers on that band cover more area, if many people are in the same place, connection can be very spotty. In comparison, my IBM X61t, released in 2007 (!) had 5GHz WiFi, so it’s hardly new technology. In fact, for about 30EUR you can change your WiFi card inside the case for one that supports Bluetooth+802.11abgn, i.e. all that is inside plus 5GHz WiFi. I still cannot understand why a computer that costs 900+ EUR would cheap out on such a component — especially since Dell can get bulk discount, so the upgrade for them would be around 10 EUR at most.
The system comes with a DVD writer included, but I don’t have any use for that. Who uses DVDs nowadays? If I want to watch a movie, I use Blu-Ray — after all, the display is Full HD! Having a Blu-Ray option would have been easy for the manufacturer, as the DVD player included is a standard one, so it can be easily swapped to an internal notebook Blu-Ray reader. Such readers cost around 60EUR at any online retailer. In fact, a Blu-Ray internal writer would cost no more than 80EUR. Dell missed out on this completely, for no good reason. Yes, it’s for business, but even business people need to back up their HDD and a DVD writer with a capacity of 4GB won’t be of any help.
The bad
Build quality is terrible. This is very surprising at this price range and in this category (i.e. business). First off, the screen’s backplate fits so badly to the front that there are holes larger than 2mm on the right side, and almost none on the left:

Left side of panel

Right side of panel
The same, though less accentuated, is true for the palmrest. You can clearly see that the plastic fits differently on the two sides, and in fact fits unevenly on both:

Left side of front

Right side of bottom
Similarly, the bottom sticker of the laptop with the most important piece of information, the Service Tag, is of such a low quality that after only 2 months of use the numbers got completely erased, and only the barcode (blacked out for privacy) remains readable:

My Service Tag — other than the barcode (blacked out) it’s unreadable
Finally, Linux support is terrible. I wanted to get reimbursed for the Windows 7 licence, but they refused it, which I think is clearly illegal, but of course I don’t have months to waste and money to burn to get some 50-100 EUR back. In the same spirit, there is no proper support for controlling the fan under Linux, as the highest level of the fan cannot be attained with the linux driver, and there is no proper palm detection support for the touchpad. The AMD Linux driver available at the time of purchase crashed X11 at startup, but the new one (fglrx 8.980) is flawless, and I have to commend AMD the on that.
Conclusions
The Vostro 3560 is a nice piece of machine but it’s not quite business quality and its makers prefer not to hear the word Linux uttered. However, if you are ready to shell out some money on a Blu-Ray drive, don’t intend to use Linux and are content with mediocre build quality with holes between elements the size an edge of a penny, the Vostro 3560 is a good choice. Otherwise, maybe hold out for a better offer.
[paypal-donation]