How to use CryptoMiniSat 2.9 as a library

There have been some questions asked about how to use CryptoMiniSat as a library. Here, I give a simple example usage to help any future potential users. If there are any question that seems unanswered, please feel free to add them as a comment to this post.

First, we initialize the solver with high verbosity:

#include "cmsat/Solver.h"
using namespace CMSat;

SolverConf conf;
conf.verbosity = 2;
Solver solver(conf);

Then we add the variables 0..9:

for(int i = 0; i < 10; i++) {
  solver.newVar();
}

And add a clause that would look in the DIMACS input format as "2 -5 10 0":

vec clause;
clause.push(Lit(1, false));
clause.push(Lit(4, true));
clause.push(Lit(9, false));
solver.addClause(clause);

We now create the assumptions that would look in DIMACS input format as "1 0" and "-5 0":

vec assumps;
assumps.push(Lit(0, false));
assumps.push(Lit(4, true));

We now solve with these assumptions:

lbool ret = solver.solve(assumps);

Let's see if the state of the solver after solving is UNSAT regardless of the assumptions:

if (!solver.okay()) {
  printf("UNSAT!\n");
  exit(0);
}

Note that okay() can only be FALSE if "ret" was "l_False". However, it is important to distinguish between two kinds of l_False: one where only the assumptions couldn't be satisfied, and one where no matter what the assumptions are, the problem is unsatisfiable. See below for more.

Now let's check that the solution is UNSAT relative to the assumptions we have given. In this case, let's print the conflicting clause:

if (ret == l_False) {
  printf("Conflict clause expressed in terms of the assumptions:\n");
  for(unsigned i = 0; i != solver.conflict.size(); i++) {
    printf("%s%d ", (solver.conflict[i].sign()) ? "" : "-", solver.conflict[i].var()+1);
  }
  printf("0\n");
}

The above will print an empty clause if solver.okay() is FALSE.

Now, let's see if the solution is SAT, and if so, print the solution to console, using DIMACS notation:

if (ret == l_True) {
  printf("We have the solution, it's here: \n");
  for (unsigned var = 0; var != solve.nVars(); var++)
    if (S.model[var] != l_Undef) {
      printf("%s%d ", (solver.model[var] == l_True)? "" : "-", var+1);
      printf("0\n");
    }
}

If solver.okay() is still TRUE (which it must be, if the ret was l_True), we can now add new clauses and new variables without restriction, and solve again (potentially with different assumptions). Note that most of the above applies to MiniSat as well.

When compiling the code, you have to pass the parameters such as:

$ g++ -fopenmp -lcryptominisat myprogram.cpp -o myprogram

PS: Thanks go to Martin Albrecht for pointing out some ambiguities in my explanation of the library usage, which have now been fixed.

Visualizing SAT solving

Visualizing the solving of mizh-md5-47-3.cnf


Visualizing what happens during SAT solving has been a long-term goal of mine, and finally, I have managed to pull together something that I feel confident about. The system is fully explained in the liked image on the right, including how to read the graphs and why I made them. Here, I would like to talk about the challenges I had to overcome to create the system.

Gathering information

Gathering information during solving is challenging for two reasons. First, it’s hard to know what to gather. Second, gathering the information should not affect overall speed of the solver (or only minimally), so the code to gather the information has to be well-written. To top it all, if much information is gathered, these have to be structured in a sane way, so it’s easy to access later.

It took me about 1-1.5 months to write the code to gather all information I wanted. It took a lot of time to correctly structure and to decide about how to store/summarize the information gathered. There is much more gathered than shown on the webpage, but more about that below.

Selecting what to display, and how

This may sound trivial. Some would simply say: just display all information! But what we really want is not just plain information: what good is it to print 100’000 numbers on a screen? The data has to be displayed in a meaningful and visually understandable way.

Getting to the current layout took a lot of time and many-many discussions with all all my friends and colleagues. I am eternally grateful for their input — it’s hard to know how good a layout is until someone sees it for the first time, and completely misunderstands it. Then you know you have to change it: until then, it was trivial to you what the graph meant, after all, you made it!

What to display is a bit more complex. There is a lot of data gathered, but what is interesting? Naturally, I couldn’t display everything, so I had to select. But selection may become a form of misrepresentation: if some important data isn’t displayed, the system is effectively lying. So, I tried to add as much as possible that still made sense. This lead to a very large table of graphs, but I think it’s still understandable. Further, the graphs can be moved around (just drag their labels), so doing comparative analysis is not hampered much by the large set of graphs.

The final layout is much influenced by Edward Tufte‘s books. Most graphic libraries for javascript, including what I used, Dygraphs, contain a lot of chartjunk by default. For example, the professional library HighCharts is full chartjunk (just look at their webpage), and is apparently used by many Fortune 500 companies. I was appalled at this — many-many graph libraries, none that offers a clean look? Luckily, I could do away with all that colorful beautifying mess — the data is interesting, and demands no embellishments.

Creating the webpage

Creating the webpage to display what I wanted was quite difficult. I am no expert at PHP or HTML, and this was the first time I had touched javascript. Although the final page doesn’t show it much, I struggled quite a bit with all these different tools. If I had to do this again, I would choose to use a page generation framework. This time, I wrote everything by hand.

I am most proud of two things on the webpage. First is the histogram at the bottom of the graphs. I know it may not seem like it, but that is all done with a javascript I wrote that pulls data from an array that could be dynamically changed. I think it does what it’s supposed to do, and does it well. The second is that I had to tweak the graph library used (Dygraphs, the best library out there, hands down), because it was too slow at printing these ~30 graphs. The graphs can be zoomed (just click and drag on X axis), and when zooming in&out the speed was really terrible. It now works relatively fast though I had to tweak the system to trade speed for a bit of visual beauty.

Final thoughts

Making the visualization webpage was a long marathon. I feel like it’s OK now, even though there were quite a number of ideas that weren’t implemented in the end. I hope you will enjoy playing with it as much as I have enjoyed making it.

Q-DIMM, an “innovation” by ASUS

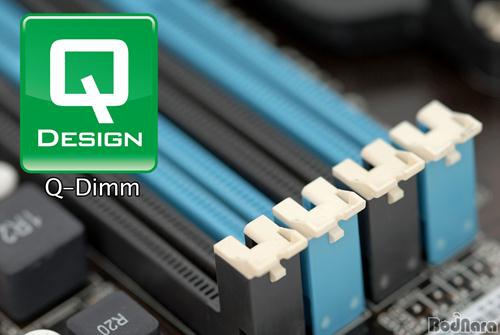
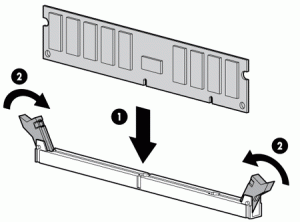
Lately, I have been having boot problems with my computer: the system would sometimes fail to boot, and at other times, it displayed the wrong memory readings. I was puzzled, so I took a look. I have six memory DIMMs installed in an ASUS motherboard. Memory modules are usually retained in their slots using two latches:

The point of these latches is to keep the memory modules in place when the computer is moved around. They thus serve the same purpose as the screws for PCIe slots or the mounting holes for the CPU coolers. My motherboard, however, is made by ASUS, and it has a “feature” called Q-DIMM, which is supposed to ease the installation of memory modules when the system has the video card already installed. This “feature” is rather simple: the latch on the right is completely missing:

Unsurprisingly, over time, some of my memory modules simply came out from their slots, making the system completely unstable. And I am far from being the only one who has had this problem.

Most probably the person who came up with this “feature” wasn’t an engineer, but a PR person. It is however rather sad that a technological company such as ASUS should make technical decisions based on PR. By the above logic, I wonder why they didn’t remove both latches. And while they were at it, get rid of all those pesky screw holes for the PCIe slots, and the mounting holes for the CPU cooler, too — things would be much easier to install!

Seriously, though, this is just unbelievable. Fun part is, ASUS sells this “feature” as an innovation that is available only to their high-end (and more expensive) motherboards. I don’t know whether to laugh or cry that you have to spend less to get a more robust, stable system.

On hyper-binary resolution

Hyper-binary resolution is actually quite straightforward, or at least appears to be. Let’s take the following example. The clauses in our database are the following:

-a V b
-a V c
-b V -c V g
-b V -c V d
-d V g

Let’s set a to true, and see what happens. Immediately, b and c get set to true through binary clauses. If we now propagate g through the clause -b V -c V g, we ought to do hyper-binary resolution straight away, and add the clause -a V g — some call this lazy hyper-binary resolution. Good, one more binary clause!

But then… So now we have nothing to propagate using only binary clauses, we have to propagate using a long clause, -b V -c V d. As good citizens, we also do (lazy) hyper-binary resolution, coming up with the clause -a V d. Good, one more binary clause! One slight glitch now… d propagates to g, using a binary clause. But this means that setting a can propagate to g without -a V g, the first hyper-binary clause we added! So the first hyper-binary clause we added is in fact useless, it needs to be removed. If we applied transitive reduction, it would remove the first hyper-binary clause -a V g automatically.

Let’s go a bit deeper here. How could we have avoided adding the first hyper-binary clause? The obvious answer is: we should have started with -b V -c V d instead of -b V -c V g. But how easy would have it been to know (i.e. calculate) that starting with that different long clause would have made our work easier? I am not sure it would have been easy to know. And of course the example above is very trivial. It could be made much-much more complicated: g could have been reached with any number of hyper-binary resolutions from d — so simple binary look-ahead would not have helped.

I am stuck here. Any ideas?

A nifty way of saving time with OpenCL

In OpenCL, the platform for using the graphics card as a form of highly parallelised machine, reading and writing to the memory of the card is very expensive. For this reason, the OpenCL standard offers a set of highly flexible ways of writing and reading data to- and from the OpenCL device. Using these flexible systems takes time to get used to, but seem to be necessary to get the most out of the graphics card.

The Problem

If data needs to be processed, a standard way of pushing it through the compute device is to use two instances of an OpenCL kernel: while one is executing, the system is reading out the finished data and uploading the new data to compute for the other kernel. Then the kernels switch places, kernel 2 is processing, while data is read-written for kernel 1. This requires the programmer to index every data piece (since there are now two of them), and make sure to get the last iteration right. This latter is tricky, because even if there is no longer data to process, kernel 2 may still be executing even though kernel 1 can now be stopped.

These difficulties make the system tricky to get right, though not impossible. In this blogpost I would like to share with you a nifty trick I have found that completely eliminates this complexity, significantly cleaning up code, while keeping the same speed.

The Solution

Since OpenCL 1.1, OpenCL supports multithreading. While managing threads is one of the most dreaded parts of programming, OpenMP makes things extremely simple. The architecture we will need is the following:

  1. A single-kernel system that churns through data. Let us call this Worker
  2. A simple class that keeps in mind which data pieces have been finished with. Let us call this Dealer

There will be two Workers, and one Dealer. When the Worker requests data from the Dealer, it does it inside a critical OpenMP directive. The Dealer is simply initialised with the data to read through, and deals this data out to the Worker upon request, and marks the data piece as ‘done’. If there are no more data to work on, the Worker exits. The only tricky part is the startup, which should look like:

//Don't allow dynamic number of threads
omp_set_dynamic(0);

//Set the number of threads we need
omp_set_num_threads(2);

//Initialise Dealer
Dealer dealer(my_options);

#pragma omp parallel
{
  int thread = omp_get_thread_num();
  int num_threads = omp_get_num_threads();

  Worker worker(&dealer, my_options);
  worker.compute();
}

It’s really simple, and works on all platforms where OpenMP is supported, which is pretty much everything, including Windows, Linux, embedded devices, etc. The really nice part about this architecture though is that it allows for way more than just getting around the problems with multiple kernels in the same source code.

The advantages

First of all, this architecture allows for the Dealer to do much more than just deal out data. You can set the number of threads to 3, set the workers to do their stuff, and wake up the Dealer every 5 seconds to dump the data, for instance. This only needs a “while(!finished) { wait(5sec); dump_my_data();}” loop in Dealer. Since the other threads can simply continue working while Dealer is writing to disk, this may be quite an important advantage in case the data you are generating is large. Similarly, Dealer could pre-load the data from disk that is to be dealt out to Workers.

Another very nice advantage of the above is that there can be any number of Workers, which sounds crazy until you get your hands on a multi-GPU computer. To take advantage of all GPUs in the system, the Workers simply need to be paremetrised with the device number that we wish to use. For example, if we have two OpenCL devices on a machine, we need to launch 4 threads, with device numbers 0,0 and 1,1. If the data chunks to compute are small relative to the overall data, e.g. data chunks need approx. 1 minute to process, but the overall data takes more than an hour, the dealer will distribute the load pretty evenly among the GPUs, so the GPUs can be even of a mixed speed, and it won’t affect the overall finish time much.

Conclusions

Although the proposed architecture uses multi-threading, something that most programmers fear (sometimes rightly so), it leads to a significantly cleaner and more flexible code that can do more with less. Using this architecture, the code should be easier to write, maintain, and extend — something all good programmers strive for.